birds-mpbx-gljs
Adding interactivity to your map (information pop-up and data clustering)
This tutorial will guide you to adding information popups to your map and improve the visual style of the data using clustering.
Displaying popup to show data information on click.
- Open your
index.htmlin your text editor. - Add the following code within your script, after the
map.on('load', function()code block.
map.on('click', 'birds', function (e) {
var coordinates = e.features[0].geometry.coordinates.slice();
var description = e.features[0].properties.en_name;

while (Math.abs(e.lngLat.lng - coordinates[0]) > 180) {
coordinates[0] += e.lngLat.lng > coordinates[0] ? 360 : -360;
}

new mapboxgl.Popup()
.setLngLat(coordinates)
.setHTML(description)
.addTo(map);
});
The above code does the following: when a click event occurs on a feature in the birds layer, open a popup at the location of the feature, with description HTML from its properties.
- Save your
index.htmland open the file in your browser.
Clustering overlapping points
Our current point styling looks cluttered at low zoom level, for example, there are a lot of overlapping points with a lot of bird sightings. We can improve the visuals of our map by adding clustering using the same data-driven styling capabilities of Mapbox GL JS.
- Open your
index.htmland change themap.addSourcesection of the code.
map.addSource('birds', { type: 'geojson',
                             data: url,
                             cluster: true,
                             clusterMaxZoom: 12,
                             clusterRadius: 30 });
This activates the clustering option to your GeoJSON with a max zoom to cluster points at z12 and the radius of each cluster when clustering points.
- Add the following code, after preceding the
map.addSource.
map.addLayer({
      id: 'clusters',
      type: 'circle',
      source: 'birds',
      filter: ['has', 'point_count'],
      paint: {
        'circle-color': [
          'step',
          ['get', 'point_count'],
          '#51bbd6',50,
          '#f1f075',100,
          '#f28cb1'
        ],
        'circle-radius': [
          'step',
          ['get', 'point_count'],
          20,50,
          30,100,
          40
        ]
      }
    });
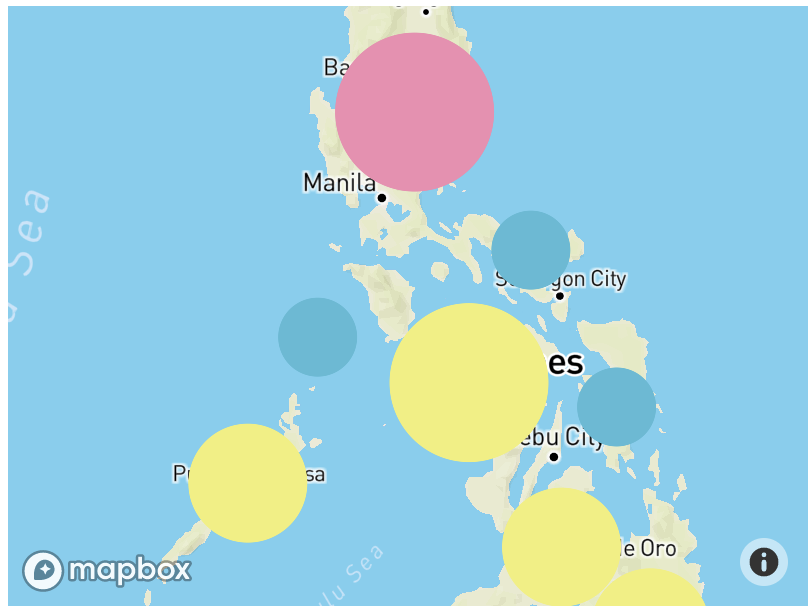
The above code uses the step expressions to style clustered points with three types of circles:
- Blue, 20px circles when point count is less than 50
- Yellow, 30px circles when point count is between 50 and 100
-
Pink, 40px circles when point count is greater than or equal to 100
- Save your
index.htmland open the file in your browser.
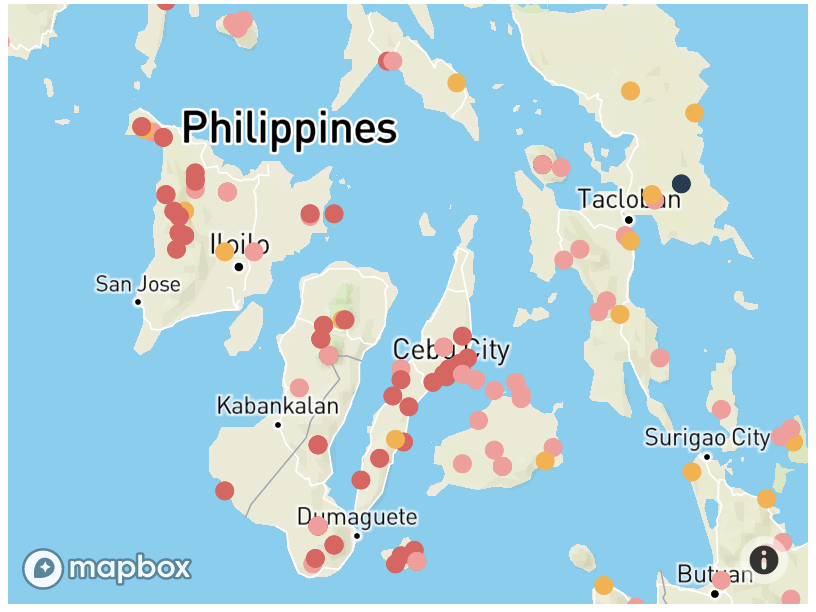
- Finally, change your earlier point style to show colors for unclustered points by its status and show pop-up.
map.addLayer({
          id: 'unclustered-point',
          type: 'circle',
          source: 'birds',
          filter: ['!', ['has', 'point_count']],
          paint: {
            'circle-radius': {
              'base': 1.75,
              'stops': [
                [12, 3],
                [22, 180]
              ]
            },
            'circle-color': [
              'match', ['get', 'status'],
              'CR', '#fbb03b',
              'DD', '#223b53',
              'EN', '#e55e5e',
              'Nt', '#3bb2d0',
              'VUL', '#fb9a99',
              /* other */
              '#000'
            ]
          }
        });

      });
      map.on('click', 'unclustered-point', function(e) {
        var coordinates = e.features[0].geometry.coordinates.slice();
        var description = e.features[0].properties.en_name;

        while (Math.abs(e.lngLat.lng - coordinates[0]) > 180) {
          coordinates[0] += e.lngLat.lng > coordinates[0] ? 360 : -360;
        }

        new mapboxgl.Popup()
          .setLngLat(coordinates)
          .setHTML(description)
          .addTo(map);
      });
- Save your
index.htmland open the file in your browser.
Congratulations! You have finished your map! Inspect your code and experiment with different circle-* options to make your clusters and symbols more appealing.