birds-mpbx-gljs
Loading external GeoJSON file to your map
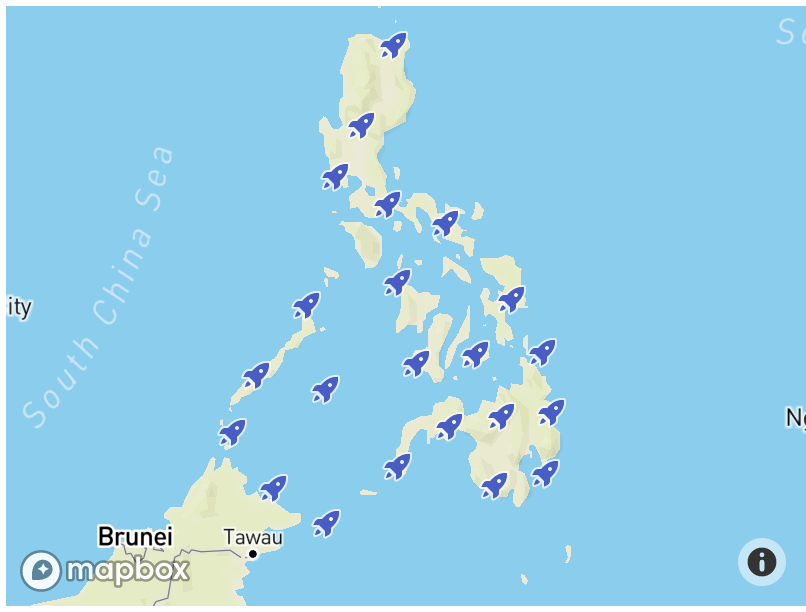
This section will guide you to adding custom data into your Mapbox map. We will add a point layer of threatened birds in the Philippines from an external GeoJSON and customize the symbols of each point based on their IUCN status.
About the data
The birds data is IUCN’s List of Threatened Birds in the Philippines from Birdlife’s Red Data Book (2005). The original list was converted to GeoJSON. Each point has the following properties:
species- scientific name of the speciesen_name- common name in Englishstatus- IUCN status as of 2005location- longitude and latitude of documented sightings
An example of the GeoJSON is below:
{
      "type": "Feature",
      "properties": {
        "species": "Spizaetus philippensis",
        "en_name": "Philippine Hawk-eagle",
        "status": "VUL"
      },
      "geometry": {
        "type": "Point",
        "coordinates": [
          121.15,
          14.8833
        ]
      }
}
Adding a GeoJSON to your map
-
To add an external GeoJSON into your map, we will use the
mapobject to get fetch the file and display them into your map. - Open your
index.htmlto a text editor. - Add the following code to after the
var map ... });section.
      map.on('load', function() {
        var url = 'https://raw.githubusercontent.com/maning/birds-mpbx-gljs/master/data/bird.geojson';
        map.addSource('birds', {
          type: 'geojson',
          data: url
        });
        map.addLayer({
          id: 'birds',
          type: 'symbol',
          source: 'birds',
          layout: {
            'icon-image': 'rocket-15'
          }
        });
     });
- Save your
index.htmland open in your browser.
Changing the style of your points using data-driven styling
We can improve the styling of the bird sighting by changing colors of each point according to the IUCN status. Using the data-driven styling available in Mapbox GL JS, we can style the data based on its properties.
-
In your text editor, change the layer
typefromsymboltocircle. This line"type": "symbol",to this ` “type”: “circle”,`. -
Delete the
"layout": {"icon-image": "rocket-15"}section of the code and copy the following:
    paint: {
        'circle-radius': {
          'base': 1.75,
          'stops': [[12, 3], [22, 180]]
        },
        'circle-color': [
          'match',
          ['get', 'status'],
          'CR', '#fbb03b',
          'DD', '#223b53',
          'EN', '#e55e5e',
          'Nt', '#3bb2d0',
          'VUL','#fb9a99',
          /* other */ '#000'
        ]
      }
The above code does the following:
- replaces the rocket symbol to a circle icon;
- make circles larger as the user zooms from z12 to z22;
-
style circle color based on the
statusproperty. For example, theCRstatus is colored#fbb03b. - Save your
index.htmland open the file in your browser.
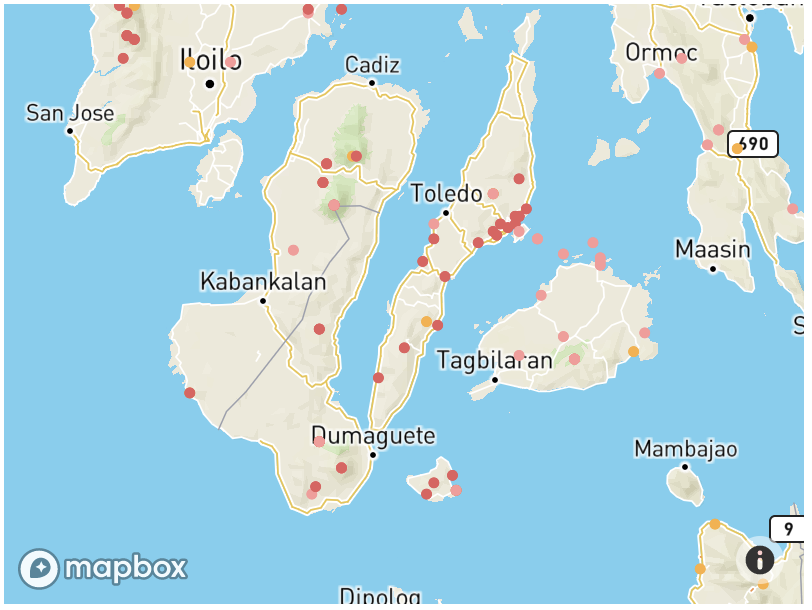
Congratulations! You have just added and styled an external data into your Mapbox map!
Before we move to the next section inspect your code and experiment with various circle size (circle-radius) and colors (circle-color).
Explore the Mapbox GL JS expressions tutorial for hints and examples.